Project Background
In a production environment, you cannot fix what you cannot see. This project details my deployment of Zabbix, an enterprise-class open-source monitoring solution, to gain real-time visibility into my homelab infrastructure.
The goal was to move away from reactive troubleshooting ("The network feels slow") to proactive monitoring ("Switch interface Gi1/0/1 has 2% packet loss").
The Environment
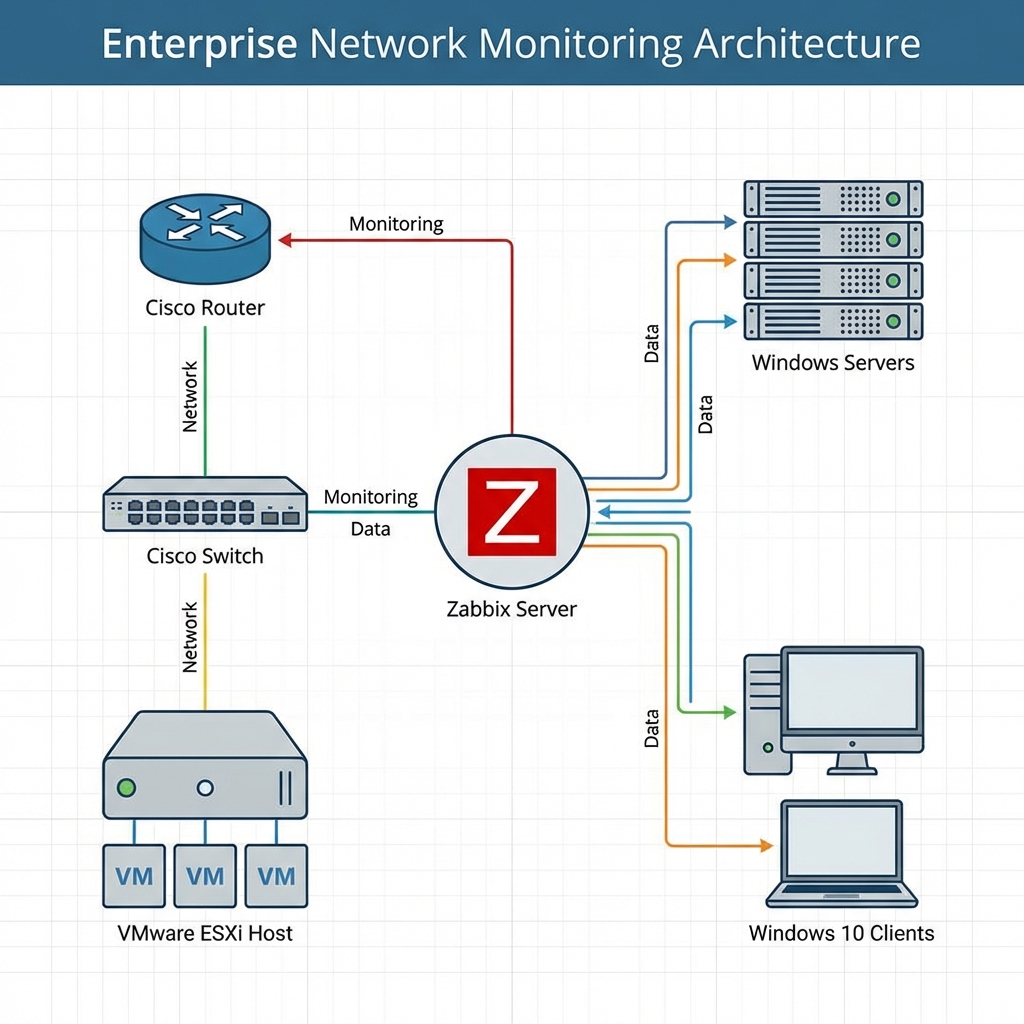
My lab environment simulates a typical small-to-medium business network:
- Monitoring Server: Zabbix Server (running on Linux)
- Network Hardware:
- 1x Physical Cisco Router (R1)
- 1x Physical Cisco Switch (S1)
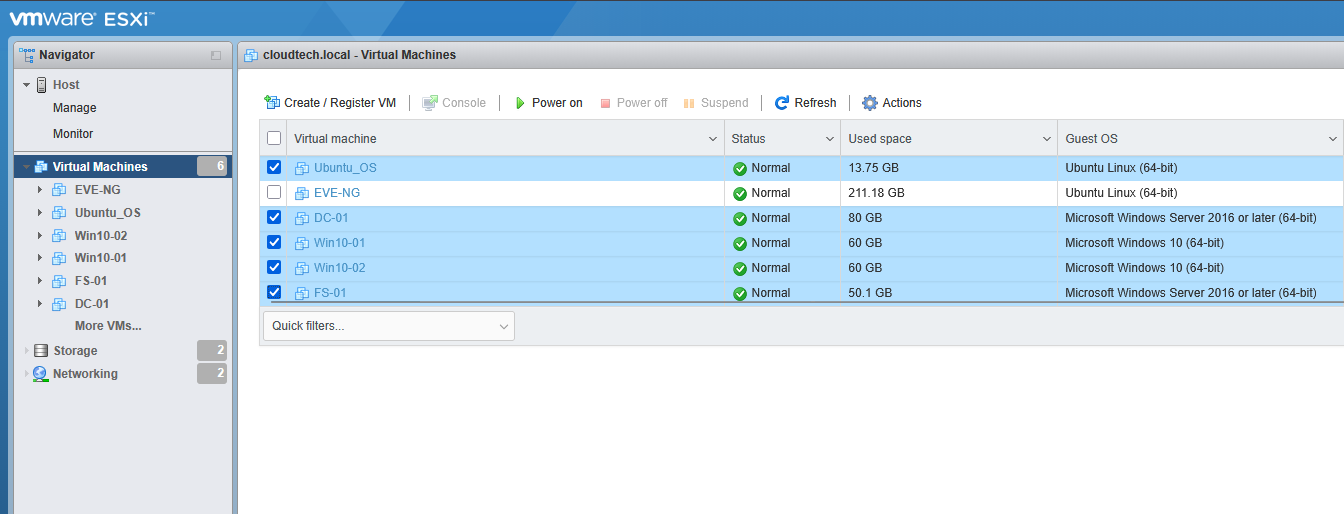
- Virtualization Host: VMware ESXi
- Endpoints (VMs):
- Windows Server 2022 (Domain Controller - DC-01)
- Windows Server 2022 (File Server - FS-01)
- Windows 10 Clients (WIN10-01, WIN10-02)
Network Device Configuration (SNMP)
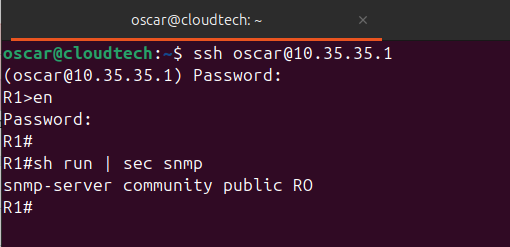
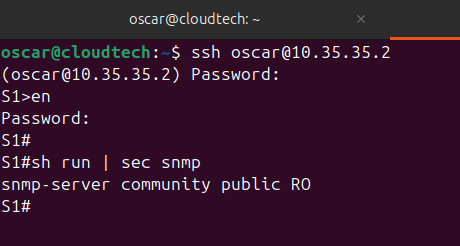
For the physical Cisco gear (R1 and S1), I utilized SNMP (Simple Network Management Protocol). This allows the Zabbix server to query the devices for interface statistics, CPU load, and uptime without needing an agent installed on the firmware.
Enable SNMP on Cisco IOS
I configured SNMP on the router and switch using using the community string "public" and read-only access.
Note: In a production environment, I would use SNMPv3 for encryption and authentication.
Windows Endpoint Configuration (Zabbix Agent)
For the Windows VMs running on ESXi, I chose the Zabbix Agent method over SNMP. The agent provides much deeper metrics, such as service states, detailed memory usage, and disk queue length.
Agent Installation
I downloaded the Zabbix Agent (MSI installer) and deployed it on DC-01, FS-01, and the Windows 10 clients. Installing the zabbix agent allows traffic on port 10050 (TCP) to flow between the agent and the server.
During the setup wizard, I configured the following:
- Host Name: Must match the hostname of the VM exactly (e.g., DC-01).
- Zabbix Server IP: Entered the IP of my Linux Zabbix server.
- Server or Proxy for Active Checks: Entered the same Zabbix Server IP.
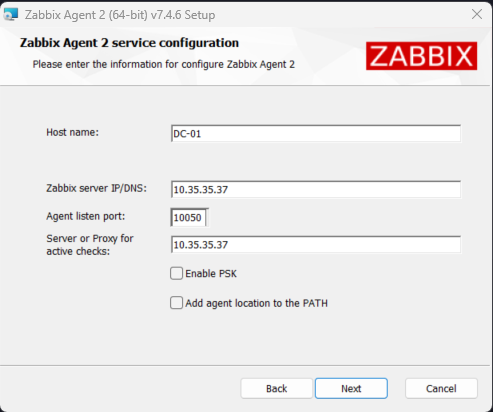
Once installed, the service Zabbix Agent starts automatically.
Automating Deployment with Zabbix Auto Discovery
Manually adding hosts is inefficient and time consuming. I configured Zabbix Auto Discovery to scan my network subnet and automatically add devices as they come online.
Creating the Discovery Rule
In the Zabbix Dashboard, I navigated to Data collection > Discovery and created a new rule called Device Discovery to discover the devices in my network.
- IP Range: 10.35.35.1-254 (to cover the entire subnet)
- Update Interval: 1m
- Enabled: Yes
- Checks: for Network Devices
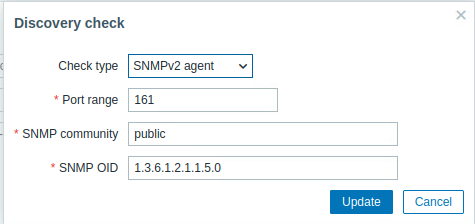
- Check type: SNMPV2 agent
- Port range: 161
- SNMPv2 community: public
- SNMP OID: 1.3.6.1.2.1.1.5.0 (to identify the system name)
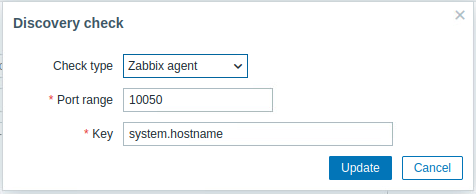
- Checks: for Windows Devices
- Check type: Zabbix agent
- Port range: 10050
- Key: system.hostname (to get the name of the host)
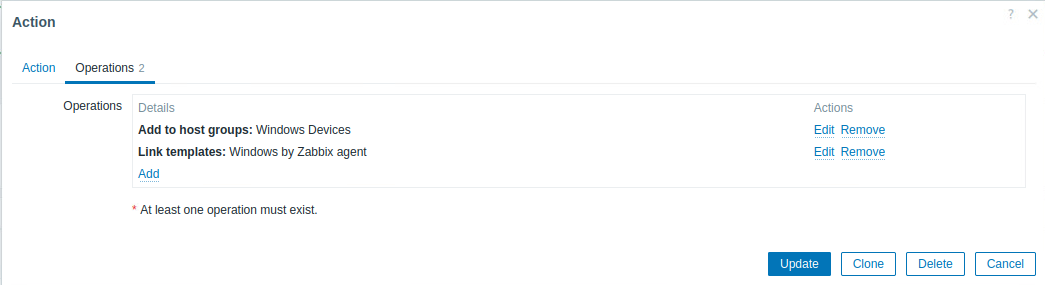
Create Discovery Actions
Next, I defined what Zabbix should do when it finds a device. I went to Alerts > Actions > Discovery actions and created 2 actions:
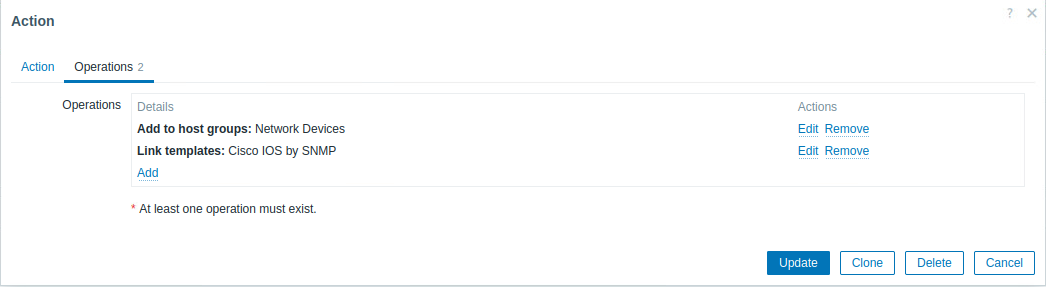
- Condition: If "Service Type" equals "SNMPv2 agent"
- Operation: Add to host groups "Network Devices"
- Operation: Link to templates "Cisco IOS by SNMP"
- Condition: If "Service Type" equals "Zabbix Agent"
- Operation: Add to host groups "Windows Devices"
- Operation: Link to templates "Windows by Zabbix agent"
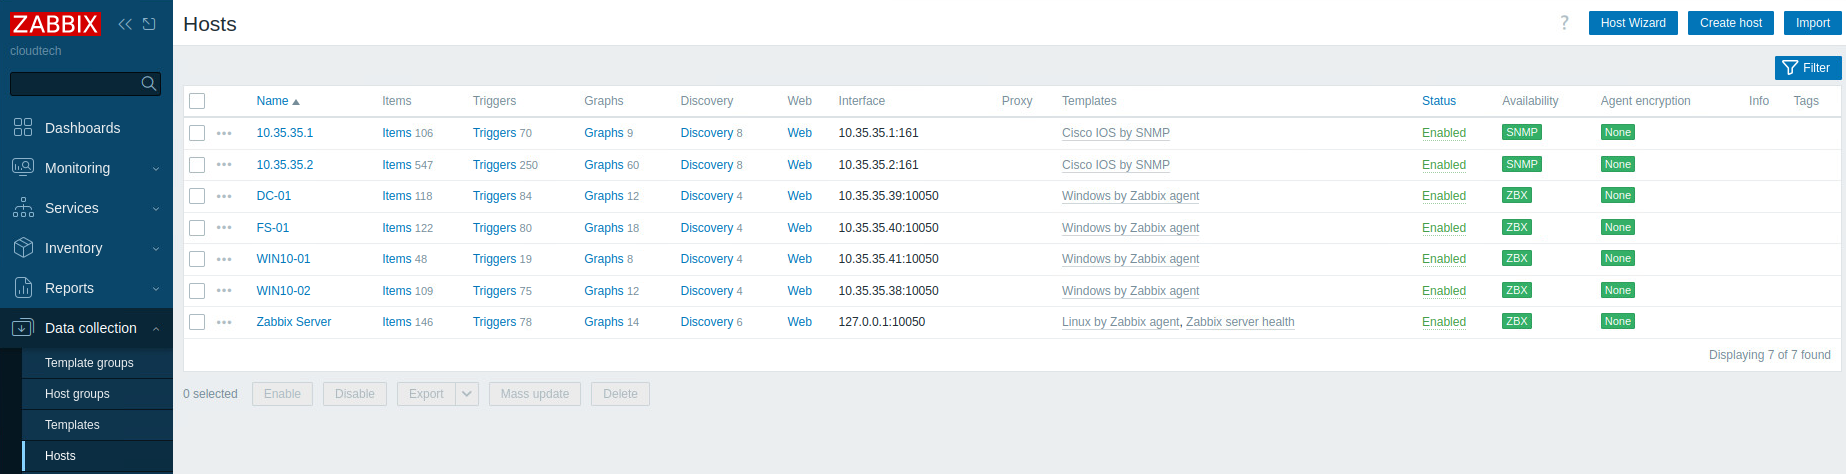
This automation means that as soon as I configure R1 or install the agent on DC-01, they automatically appear in my dashboard within minutes. The network devices shows with their IP addresses (rename them to R1 and S1) and the windows devices shows with their hostnames.
Dashboards
After the setup, I built custom dashboards to visualize the health of the infrastructure in real-time. These dashboards provide at-a-glance visibility into critical metrics across network and server infrastructure.
Network Devices Dashboard
This dashboard provides comprehensive monitoring of the physical network layer, tracking both the router (R1) and switch (S1) performance metrics.
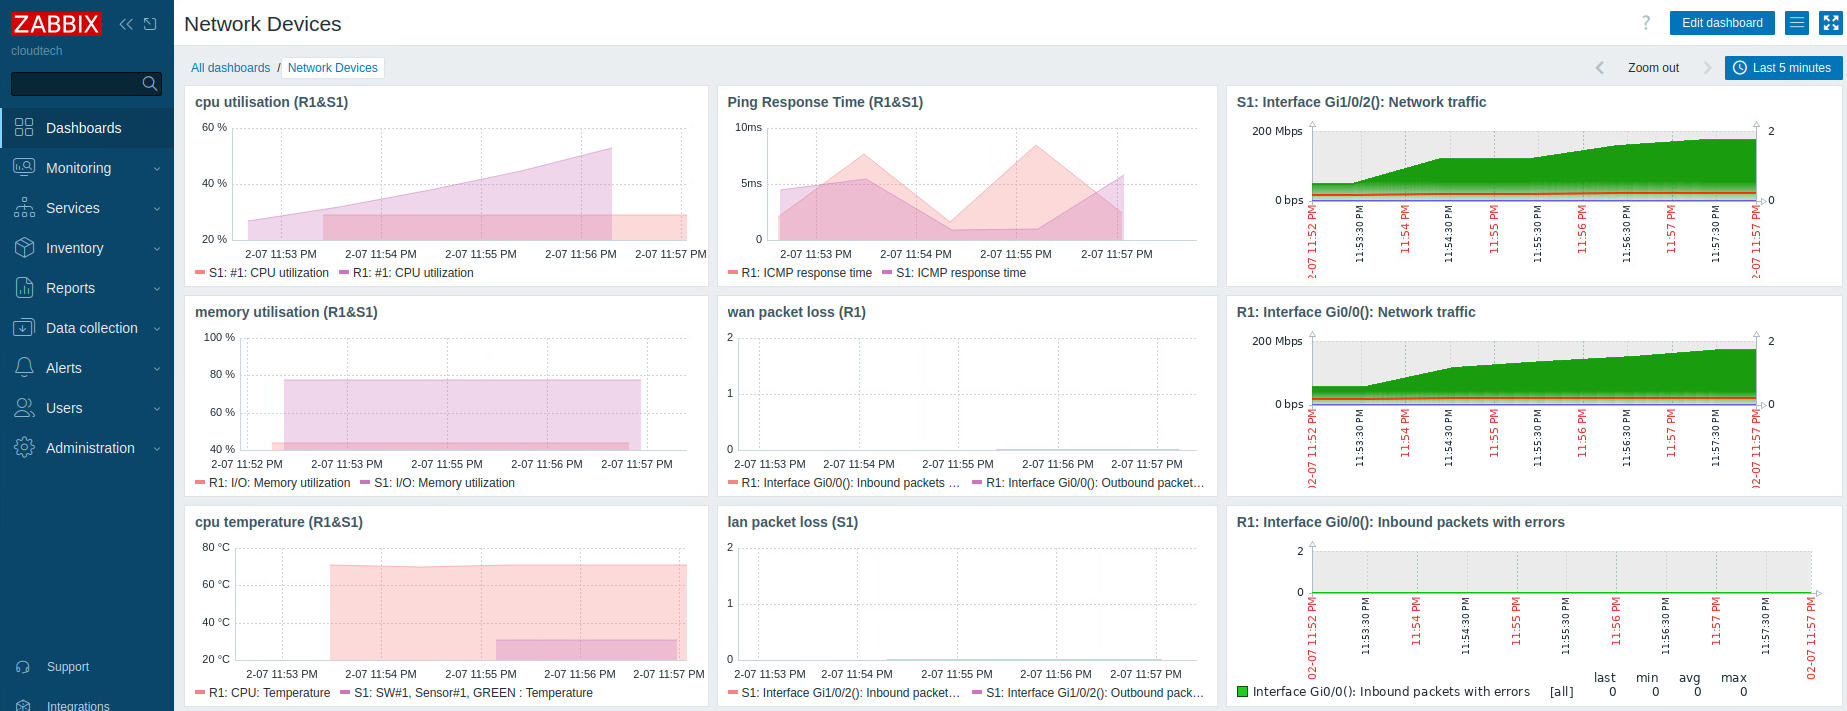
Key Widgets:
- CPU Utilization (R1 & S1): Tracks processor load on both devices to identify performance bottlenecks
- Memory Utilization (R1 & S1): Monitors RAM usage to prevent memory exhaustion issues
- CPU Temperature (R1 & S1): Tracks thermal performance to prevent hardware damage from overheating
- Ping Response Time: Measures ICMP latency for both devices to detect network congestion
- WAN Packet Loss (R1): Monitors dropped packets on the router's WAN interface to identify ISP issues
- LAN Packet Loss (S1): Tracks packet loss on switch interfaces to detect cabling or port issues
- Interface Network Traffic: Displays inbound/outbound bandwidth utilization on key interfaces (Gi1/0/2 on S1, Gi1/0/2 on R1)
- Inbound Packets with Errors: Monitors interface errors that could indicate physical layer problems
Why it matters: This dashboard allows me to quickly distinguish between ISP-related issues (high WAN packet loss) versus internal network problems (high LAN packet loss or interface errors). The interface bandwidth graphs help identify bottlenecks before users complain about slow performance.
Windows Devices Dashboard
This dashboard focuses on the application and OS layer, providing deep visibility into Windows server and workstation health.
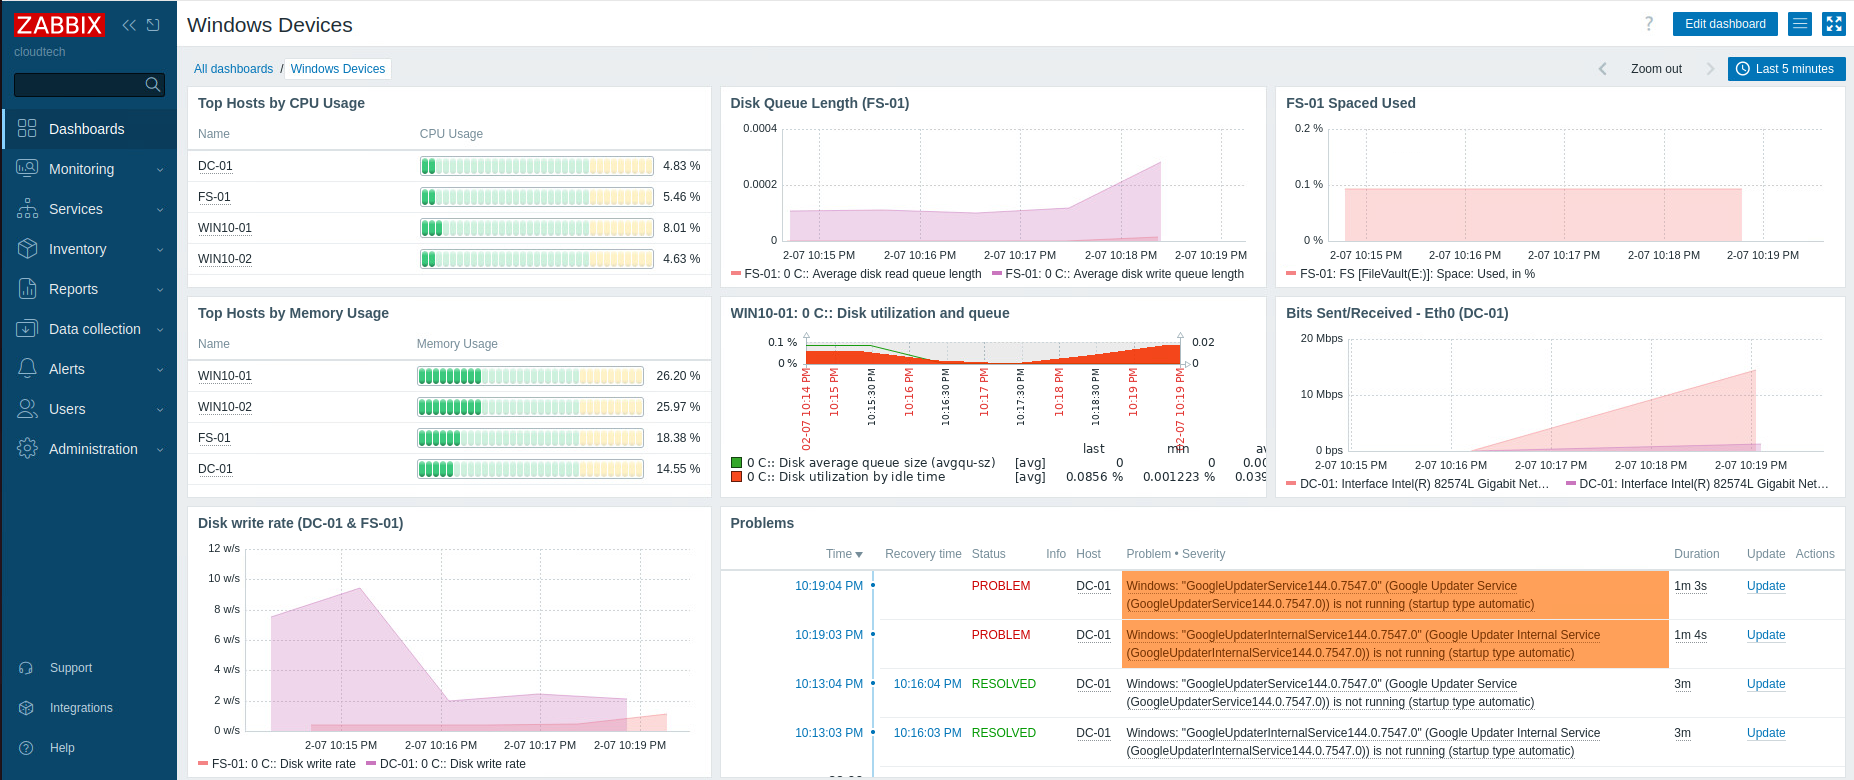
Key Widgets:
- Top Hosts by CPU Usage: Ranks all Windows devices (DC-01, FS-01, WIN10-01, WIN10-02) by processor utilization
- Top Hosts by Memory Usage: Identifies which systems are consuming the most RAM
- Disk Queue Length (FS-01): Critical metric for the file server showing storage I/O performance
- Disk Utilization and Queue (WIN10-01): Monitors disk performance on workstations
- Disk Write Rate (DC-01 & FS-01): Tracks write operations per second on critical servers
- Spaced Used (FS-01): Monitors storage capacity to prevent disk space exhaustion
- Network Traffic (DC-01): Displays bits sent/received on the domain controller's network interface
- Problems Panel: Real-time alert feed showing active issues (e.g., stopped Windows services like GoogleUpdater)
Why it matters: The Disk Queue Length widget on FS-01 is particularly critical. High values indicate storage bottlenecks that cause file access delays, even when CPU usage is normal. The Problems panel provides immediate visibility into service failures, allowing for rapid response before users are impacted. The CPU and memory rankings help identify resource-constrained systems that may need hardware upgrades.
Conclusion
This project demonstrates the importance of observability in IT operations. By combining SNMP for network gear and Zabbix Agents for Windows, I created a unified "Single Pane of Glass" that allows for rapid root-cause analysis and ensures high availability for the environment.
Key Takeaways & Skills Gained
- Enterprise Monitoring: Deployed and configured Zabbix for comprehensive infrastructure monitoring.
- Agent Deployment: Installed and configured Zabbix agents on Windows endpoints for deep system metrics.
- Automated Discovery: Implemented network auto-discovery to automatically onboard new devices.
- Dashboard Creation: Built custom dashboards for network and server monitoring with actionable metrics.